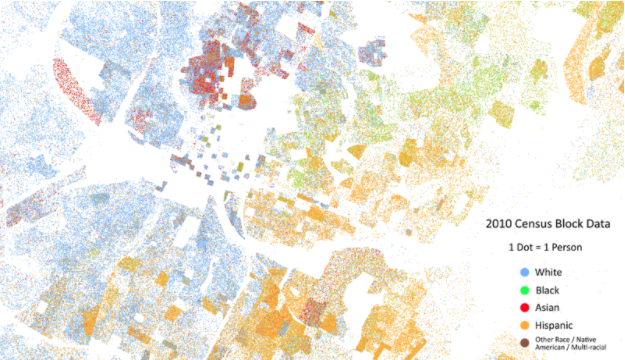
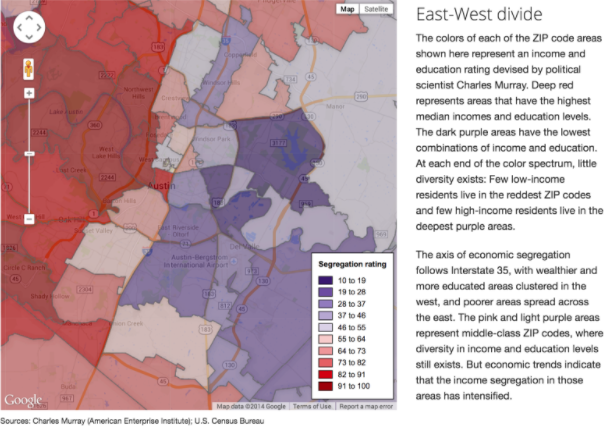
Austin, the capital of Texas, is known for its music scene, technology industry, major research universities, and liberal politics. However, despite being the liberal stronghold of a majority conservative state - Austin has been ranked the most segregated metropolitan area by the Pew Research Center (Index value of .925). In contrast, the Providence, Rhode Island and Bedford-Fall River, Massachusetts metropolitan area are ranked 233rd (Index value of .611).
Complexity theory and 'bottom up' emergent phenomenon help to explain the high level of economic and racial segregation in Austin and cities alike. However, these emergent processes are difficult to communicate.
With the help of NetLogo's Segregation model - students can simulate the micro-behaviors that lead to macro-segregation patterns we see in cities across the country.
Dr. Stroup, the Principle Investigator of the GbCC for STEM Education project, used the NetLogo Segregation model on March 1st, 2017 in a campus-wide session at the University of Massachusetts at Dartmouth discussing social issues facing the country.
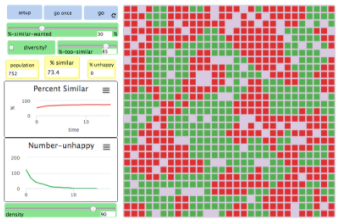
The NetLogo Segregation models shows the behavior of two types of agents in a neighborhood. The red agents and green agents get along with one another. But each agent wants to make sure that it lives near some of "its own." That is, each red agent wants to live near at least some red agents, and each green agent wants to live near at least some green agents. The simulation shows how these individual preferences ripple through the neighborhood, leading to large-scale patterns. Learners can manipulate switches and sliders, or edit the code directly to make the model reflect new situations; for instance, users can:
The %-similar-wanted slider changes the percentage of preferred similarity between an individual and their neighbors.
The %-too-similar slider sets a limit to which an individual prefers their neighbors to be similar
The diversity switch models favorable policy or attitudes towards diversity
The density slider allows user to increase the number of agents on patches in the simulation.
Students during this demonstration and others like it could modify the parent code by changing the initial ratio of red and green agents in the population.
Recent and Future Developments for the NetLogo Segregation Model:
The NetLogo Segregation model has recently been converted into a Group-based Cloud Computing program – allowing multiple users to operate the simulation, make modifications, and share modifications in the Gallery View. The model has been recently used in a classroom interactions course where students were encourage to change colors, add colors, and share their modifications of the code to the gallery.
LINKS:
Bridging Differences and Creating Change – Umass Dartmouth: https://www.umassd.edu/teach-in/
Stroup and Kayumova: Valuing Diversity as a Response to (Re-) Emergent Segregation: https://calendar.umassd.edu/cal/event/showEventMore.rdo
NetLogo Segregation Model: https://webapps.umassd.edu/segregation.html
Austin-Round Rock Metropolitan area – segregation by race
Austin Area Segregation
GbCC Segregation Model


